Learning Resources
Reading Southwest Sites from Orbit: A Sensor Guide
For a Southwest archaeological survey, the practical answer is to match sensor to feature: Landsat and Sentinel-2 for broad landscape context at 10 to 30 meters, commercial or national high-resolution imagery when you need to see a roomblock or a terrace edge, and a revisit interval short enough to catch the ground before vegetation or snow closes the window.
For a Southwest archaeological survey, the practical answer is to match sensor to feature: Landsat and Sentinel-2 for broad landscape context at 10 to 30 meters, commercial or national high-resolution imagery when you need to see a roomblock or a terrace edge, and a revisit interval short enough to catch the ground before vegetation or snow closes the window. Resolution decides what you can see, revisit decides when you can see it, and licensing decides what you may publish.
The same logic travels. Colleagues working on rice terraces, monsoon floodplains, or expanding megacities across Asia face identical trade-offs, and the field has accumulated a useful body of practice around them, including choosing satellite data in Asia for regional work. The sensor vocabulary is shared even when the terrain is not.
What resolution do you actually need?
Resolution is not a single number. Spatial resolution sets the smallest object you can distinguish; a 10-meter pixel will not show a masonry wall, but it will show the field system that wall sits inside. Spectral resolution sets how many wavelength bands you receive, which is what lets a multispectral sensor separate bare soil from sage or pinyon. Temporal resolution sets how often the satellite returns.
For site survey, work backward from the feature. A great house footprint, a check dam, or an agricultural terrace needs roughly 0.5 to 2 meters to be mapped as a shape rather than inferred as an anomaly. A settlement pattern, a road, or a drainage network reads well at 10 to 30 meters. Regional questions, such as where sites might exist across a basin, tolerate 30 meters or coarser.
Panchromatic bands usually offer finer detail than the multispectral bands on the same platform, which is why pan-sharpening is common in published survey work. The trade-off is that sharpened products are processed products, and the processing should be described in any methods section.
Where can I download free satellite images of Asia?
The free archives are the same ones used in the Southwest, and they cover Asia completely. Landsat, distributed through the USGS EarthExplorer portal, provides a continuous record back to 1972 at 30-meter multispectral resolution, with 15-meter panchromatic on later missions. Sentinel-2, distributed through the Copernicus Open Access Hub, adds 10-meter bands and a five-day revisit when both satellites are combined. Both are open, both permit redistribution with attribution, and both are adequate for landscape-scale survey.
For finer work, national programs and commercial archives fill the gap. Japan's ALOS series, India's Resourcesat and Cartosat, South Korea's KOMPSAT, Thailand's THEOS, and China's Gaofen constellation all produce imagery at resolutions useful for site-level mapping, though access terms vary by program and by request. Meteorological satellites such as Himawari are not survey instruments, but their frequent refresh is useful for cloud screening before ordering a scene.
A practical workflow: define the area and season, pull the free archive first to establish context, then order high-resolution coverage only for the polygons that need it. This keeps cost and processing load proportionate to the question.
Which Asian countries fly their own Earth observation satellites?
Several do, and the list has grown steadily since the 1980s. Japan operates the ALOS and Daichi series through JAXA. India runs one of the largest national programs, with the Resourcesat, Cartosat, and RISAT families under ISRO. South Korea flies KOMPSAT through KARI. Thailand operates THEOS. China has developed the Gaofen and Ziyuan constellations. Taiwan, Vietnam, Indonesia, and Malaysia have also fielded or shared small satellite programs.
For a survey project, the practical consequence is that high-resolution coverage of Asia is not limited to a single commercial vendor. It also means that data policies differ: some programs release imagery freely, others require a proposal, and some restrict redistribution. Reading the license before planning a publication is not optional.
How does revisit interval shape a survey season?
Revisit is the constraint that field archaeologists feel most. A sensor that passes every sixteen days may miss the two-week window between snowmelt and leaf-out, which is often the best time to see surface features in the Southwest. Sentinel-2's five-day combined revisit and the Landsat constellation's eight-day combined revisit reduce that risk, but neither eliminates cloud cover.
In monsoon Asia the problem inverts: the clear season is short and the cloudy season is long, so survey planning often works around a dry window rather than a fixed calendar. The same principle applies in reverse in the Southwest, where the target window is the bare-ground period before summer growth.
A useful habit is to build a small image stack for each study area rather than a single scene: several dates across several years, so that differences in illumination, vegetation, and soil moisture can be compared. Change detection between dates often reveals features that no single image shows.
What does ground truth add to a satellite survey?
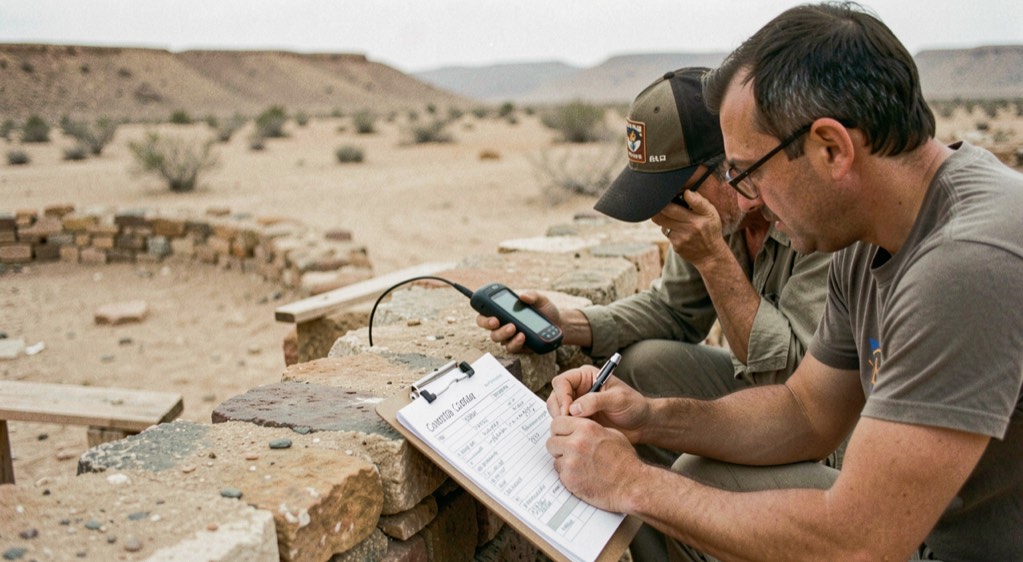
A satellite image is a measurement, not an interpretation. Ground truth, the field verification of what a pixel represents, is what converts a reflectance value into a statement about a wall, a ditch, or a midden. In the Southwest this usually means a pedestrian survey with GPS points tied to visible features, then a comparison against the imagery to see which features were detectable and under what conditions.
The result is a calibration curve for the sensor and the terrain: what fraction of known sites appear, what fraction are missed, and what false positives the imagery produces. That curve is the honest basis for any statement about site density derived from orbit.
The same discipline appears in the Asian remote sensing community, where validation is treated as a standard step rather than an afterthought. The annual ACRS proceedings archive, maintained by the Asian Association on Remote Sensing, contains a long record of such field-validated studies, and the association's linked journal publishes related work.
Putting the choice together
Start with the question, not the sensor. If the question is regional, Landsat or Sentinel-2 will answer it and cost nothing. If the question is a single site, order high-resolution imagery for a small polygon and accept the license terms that come with it. If the question is seasonal, build a stack and compare dates.
Record the sensor, the acquisition date, the processing level, and the license for every scene used. That record is what makes a satellite-based survey reproducible, and it is what allows a later reader to judge whether the interpretation holds.
The Southwest and Asia are different landscapes, but the orbital constraints are the same: resolution, revisit, and licensing. Choosing well among them is most of the work.
Source: earthexplorer.usgs.gov.